We Have Solar at Home Part 1: Can We Get Solar?
Author’s Note: This is a multi-part brain dump on everything I learned getting solar panels for a house. After I get everything down, I hope to edit it into something helpful for prospective solar customers. Something much shorter. Your questions and feedback are always welcome.
Next: We have Solar at Home Part 2
In 2022, we were fortunate enough to be able to buy a house, and immediately started shopping for solar panels. Our first concern, even though we live in California, was whether we’d have enough sunshine. For example: can you see the beautiful bridge in the background of this picture?

Marina Green
No, because it’s completely fogged over. Our neighborhood faces the ocean, and most summer days are pretty foggy. In this picture of a Little League baseball game taken hours before sunset in late May, when the east half of the city might still be sunny and 64°F, notice the spectators’ heavy coats. Notice also the complete lack of sunset, direct sunshine, or even blue sky.

South Sunset Baseball Field #1
How well will panels still work with all the fog? What we really need is a historical baseline. Fortunately, we live next door to a five-megawatt solar plant1.
Sunset Reservoir Solar Project
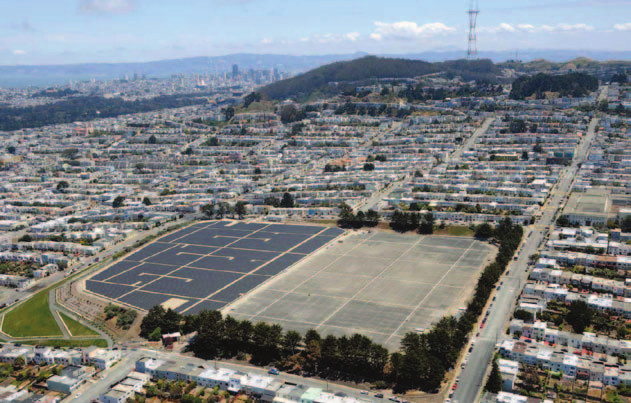
It’s been in operation since 2010. And it publishes its data2!
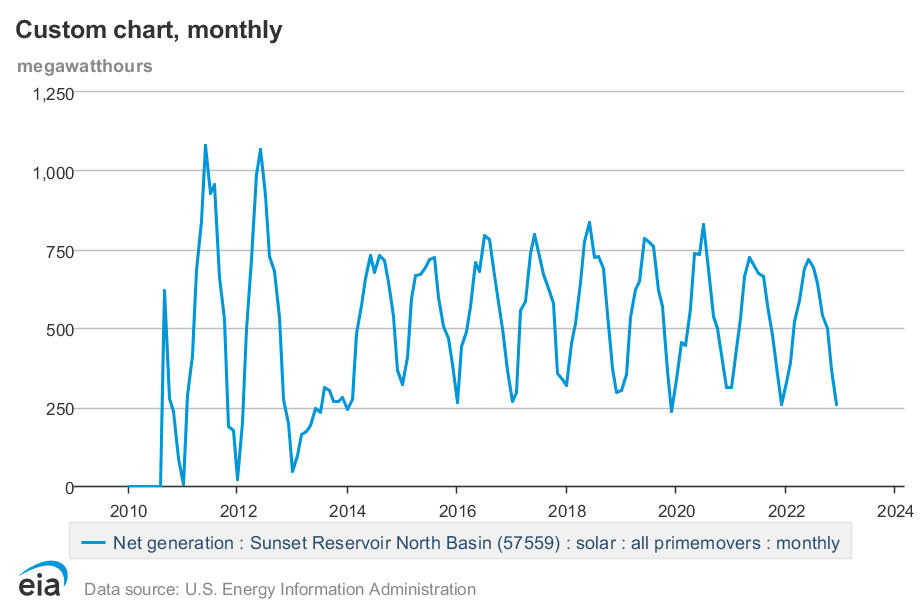
Monthly energy production at Sunset Resevoir North Basin
While there’s certainly a huge swing from winter to summer, it doesn’t look like the fog makes that much difference. Our foggy concern allayed, we started doing the numbers for our roof.
Is it worth it?
Excluding externalized costs like untaxed carbon emissions, and ignoring the deeply un-Christian notions that we are the keeper of our eight billion siblings or stewards of the flora and fauna and fungi and other phyla3, let’s focus on the money. Expensive home projects are often measured by how many years will it take until the accumulated savings exceed the future value of all the money we just spent. Let’s say the upper limit of a firm yes should be about ten, according to a rule of thumb I just made up based on being born with ten fingers4 that anything longer is too uncertain for precision. And if the breakeven point is never, it’s not financially justified.
We need to know two things to calculate the breakeven point.
- How much will we pay for electricity each year between 2023 and 2032 if we don’t get solar panels?
- How much will we pay if we do get solar panels
We can answer those questions with four numbers.
| How much electricity will we use between 2022 and 2032? | ? |
|---|---|
| How much will PG&E charge for that electricity? | ? |
| How much will the system cost to install and operate? | ? |
| How much electricity will the system generate? | ? |
How much electricity will we use between 2023 and 2032?
This is hard to predict unless you’ve already been living in the house for years, using electricity in a stable pattern, in which case you can just read your own electric bills. We didn’t want to wait that long. We’d been averaging 2700 kW·h/yr in our apartment as a family of four, which is half the regional average5. (We benefit from the mild climate and also pay for it other ways.)
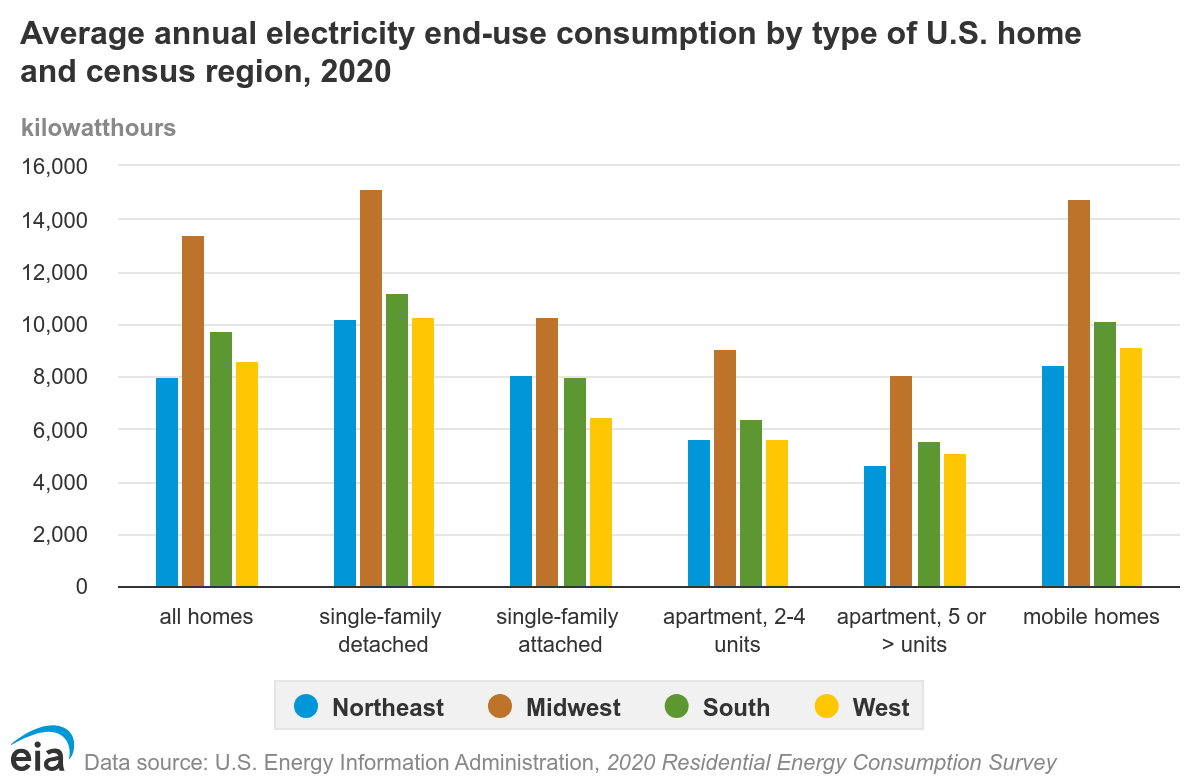
2020 Residential Energy Consumption Survey
U.S. households use almost half of their electrity to cooling air, heating air, and heating water5, but we didn’t pay for any of that in the apartment. And it had a laundry room in the basement6, and we charged our car across the street. Meanwhile the house appliances were all gas, but we’d want to switch to electricity as soon as we could. And the house came with no laundry machines, so we’d buy an electic washer and dryer immediately. So we would be adding a washer, dryer, car charging, and eventually a stove, oven, water heater, and heat pump. We guesstimated what all that would add, and came up with a range from 32176.96 to 5835.5 kW·h per year7.
How much will PG&E charge for that electicity?
Before we can estimate rates, I have to tell you about the proposal. We solicited bids from two carefully selected8 vendors, a major national company and a much smaller regional one. The national company’s salesperson argued with me over the phone. The other company came and climbed around on our roof, asked us hard questions about how we cooked our food and dried our clothes, and sent together a proposal.
Solar providers submitting applications to interconnect residential solar customers in the service areas of … PG&E, … SCE, … SDG&E, … BVES, and PacifiCorp are required to collect customer initials and a signature on the California Solar Consumer Protection Guide.9
Thus, SimplySolar’s proposal starts with twenty-two pages of CALIFORNIA SOLAR CONSUMER PROTECTION GUIDE10. Although a lot of its tips are helpful, it sounds like a close friend who worries greatly that you are marrying a mysterious stranger with a history of rich, dead spouses.
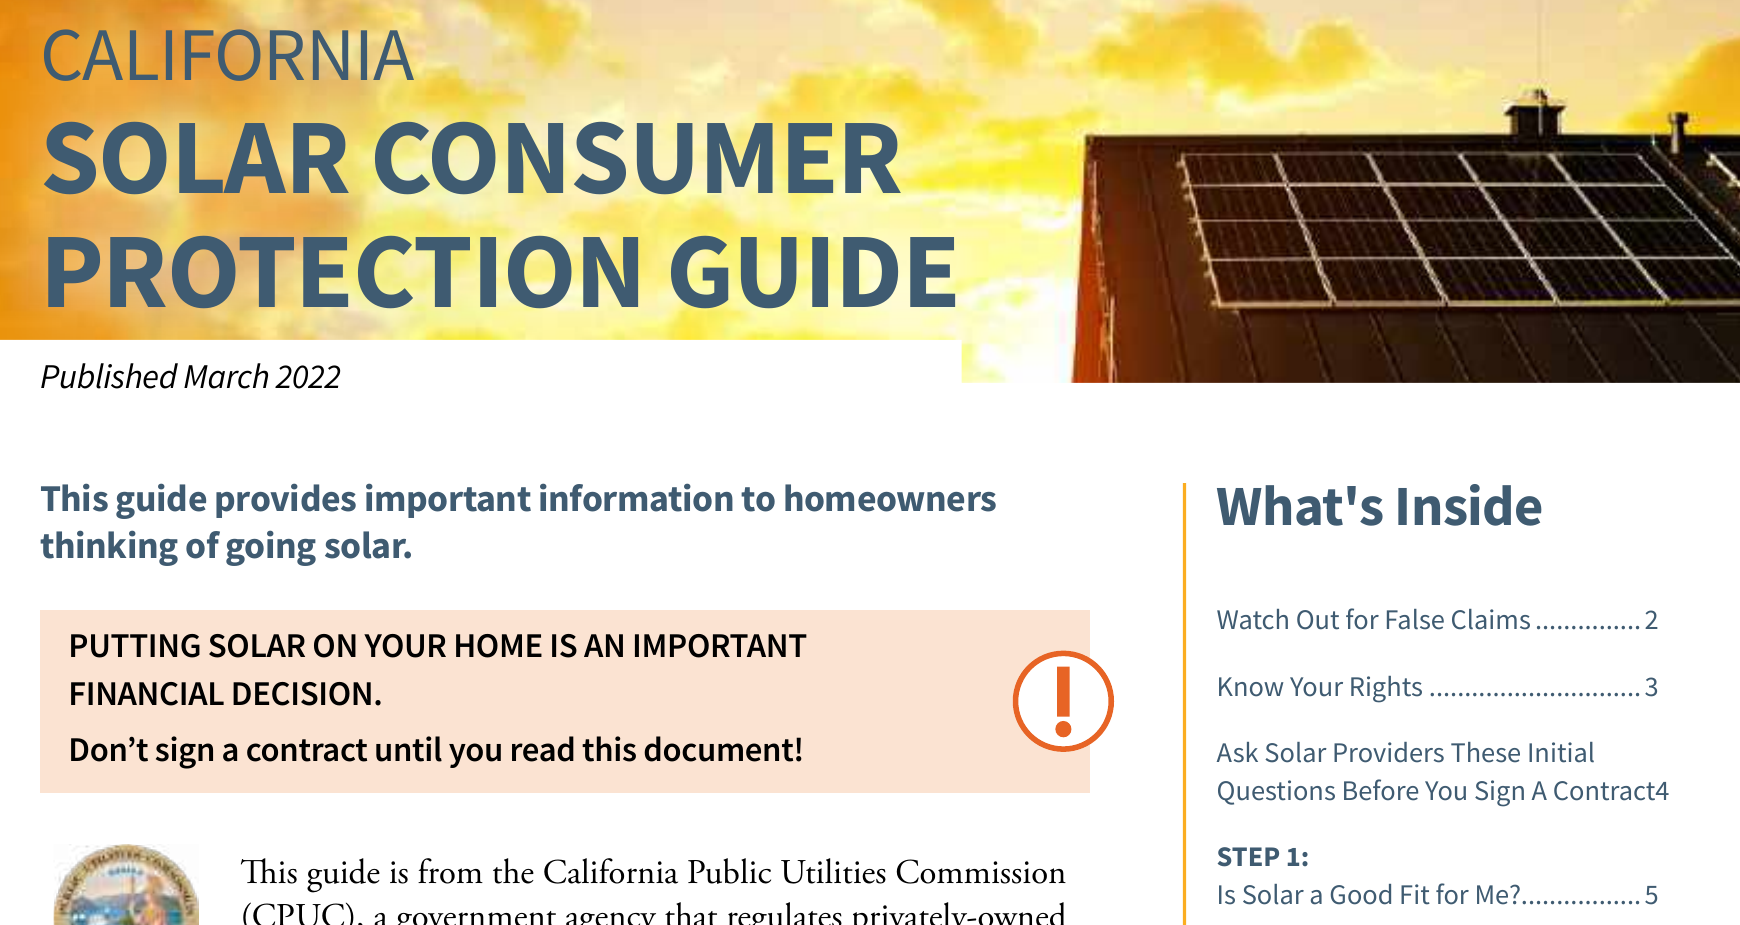
SCPG page 1
“Do you really think this Solar person is a good fit for you? All I’m saying is, don’t sign the prenup yet.”

SCPG page 2
“Your Solar friend has promised they don’t want your money, they will pay for everything?”
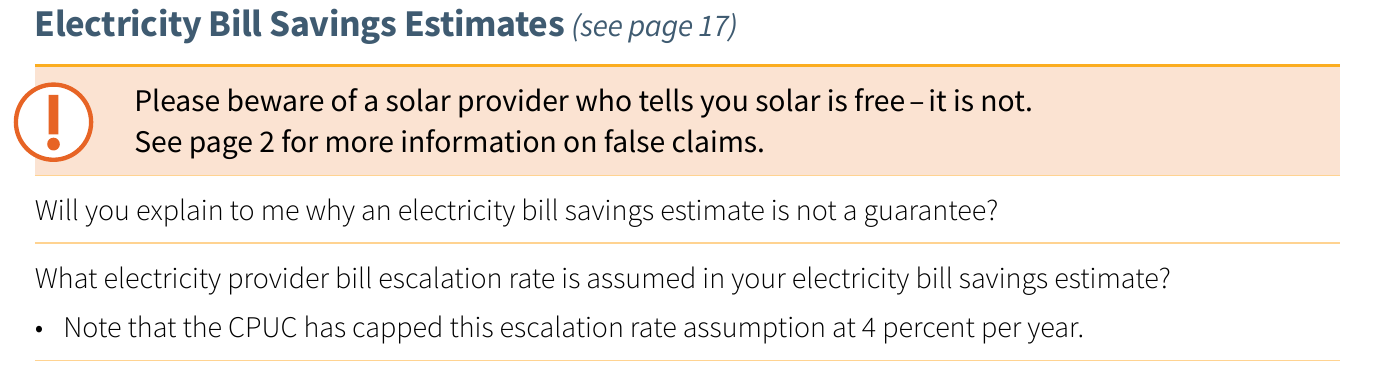
SCPG page 10
“Hey, why don’t you ask your Solar friend why they want a wedding in Romania with no guests?”
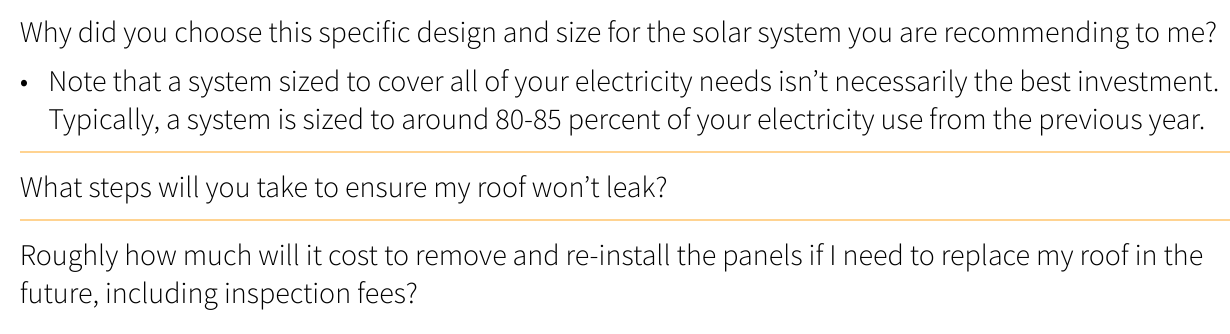
SCPG page 11
“Beware!”

SCPG page 11
“Honey, I’m just looking out for you. Even if you survive this, will anyone sane want to marry you?”
Wait a minute—go back one, what did it say?
What electricity provider bill escalation rate is assumed in your electricity bill savings estimate?
- CPUC has capped this escalation rate assumption at 4 percent per year.
Well that’s an odd thing. Is the CPUC protecting us from roving gangs of solar panel installers promising false savings, predicated on recklessly unrealistic utility rate-of-rate-increase forecasts of, say, over 4 percent per year? On a wild hunch, I dug up some historical rates, of 0.16082 $/kW·h on 2008-01-0111, and 0.33565 $/kW·h for 2022-03-0112. That’s over 7 percent. Interesting ….
Now we have two of the four answers. We’ll need between 3217 and 5835 kW·h per year and we’ll be charged $0.43 per kW·h13, increasing 7.6 percent per year.
Join us next week as to find out how much solar is going to cost!