We Have Solar at Home Part 10: The Answer
Previously: We Have Solar at Home Part 9.
The Spreadsheet
We—meaning you the reader—still don’t know how much we—meaning my household—paid for electricity in 20231. I copied all of the important numbers in all the bills into a spreadsheet.
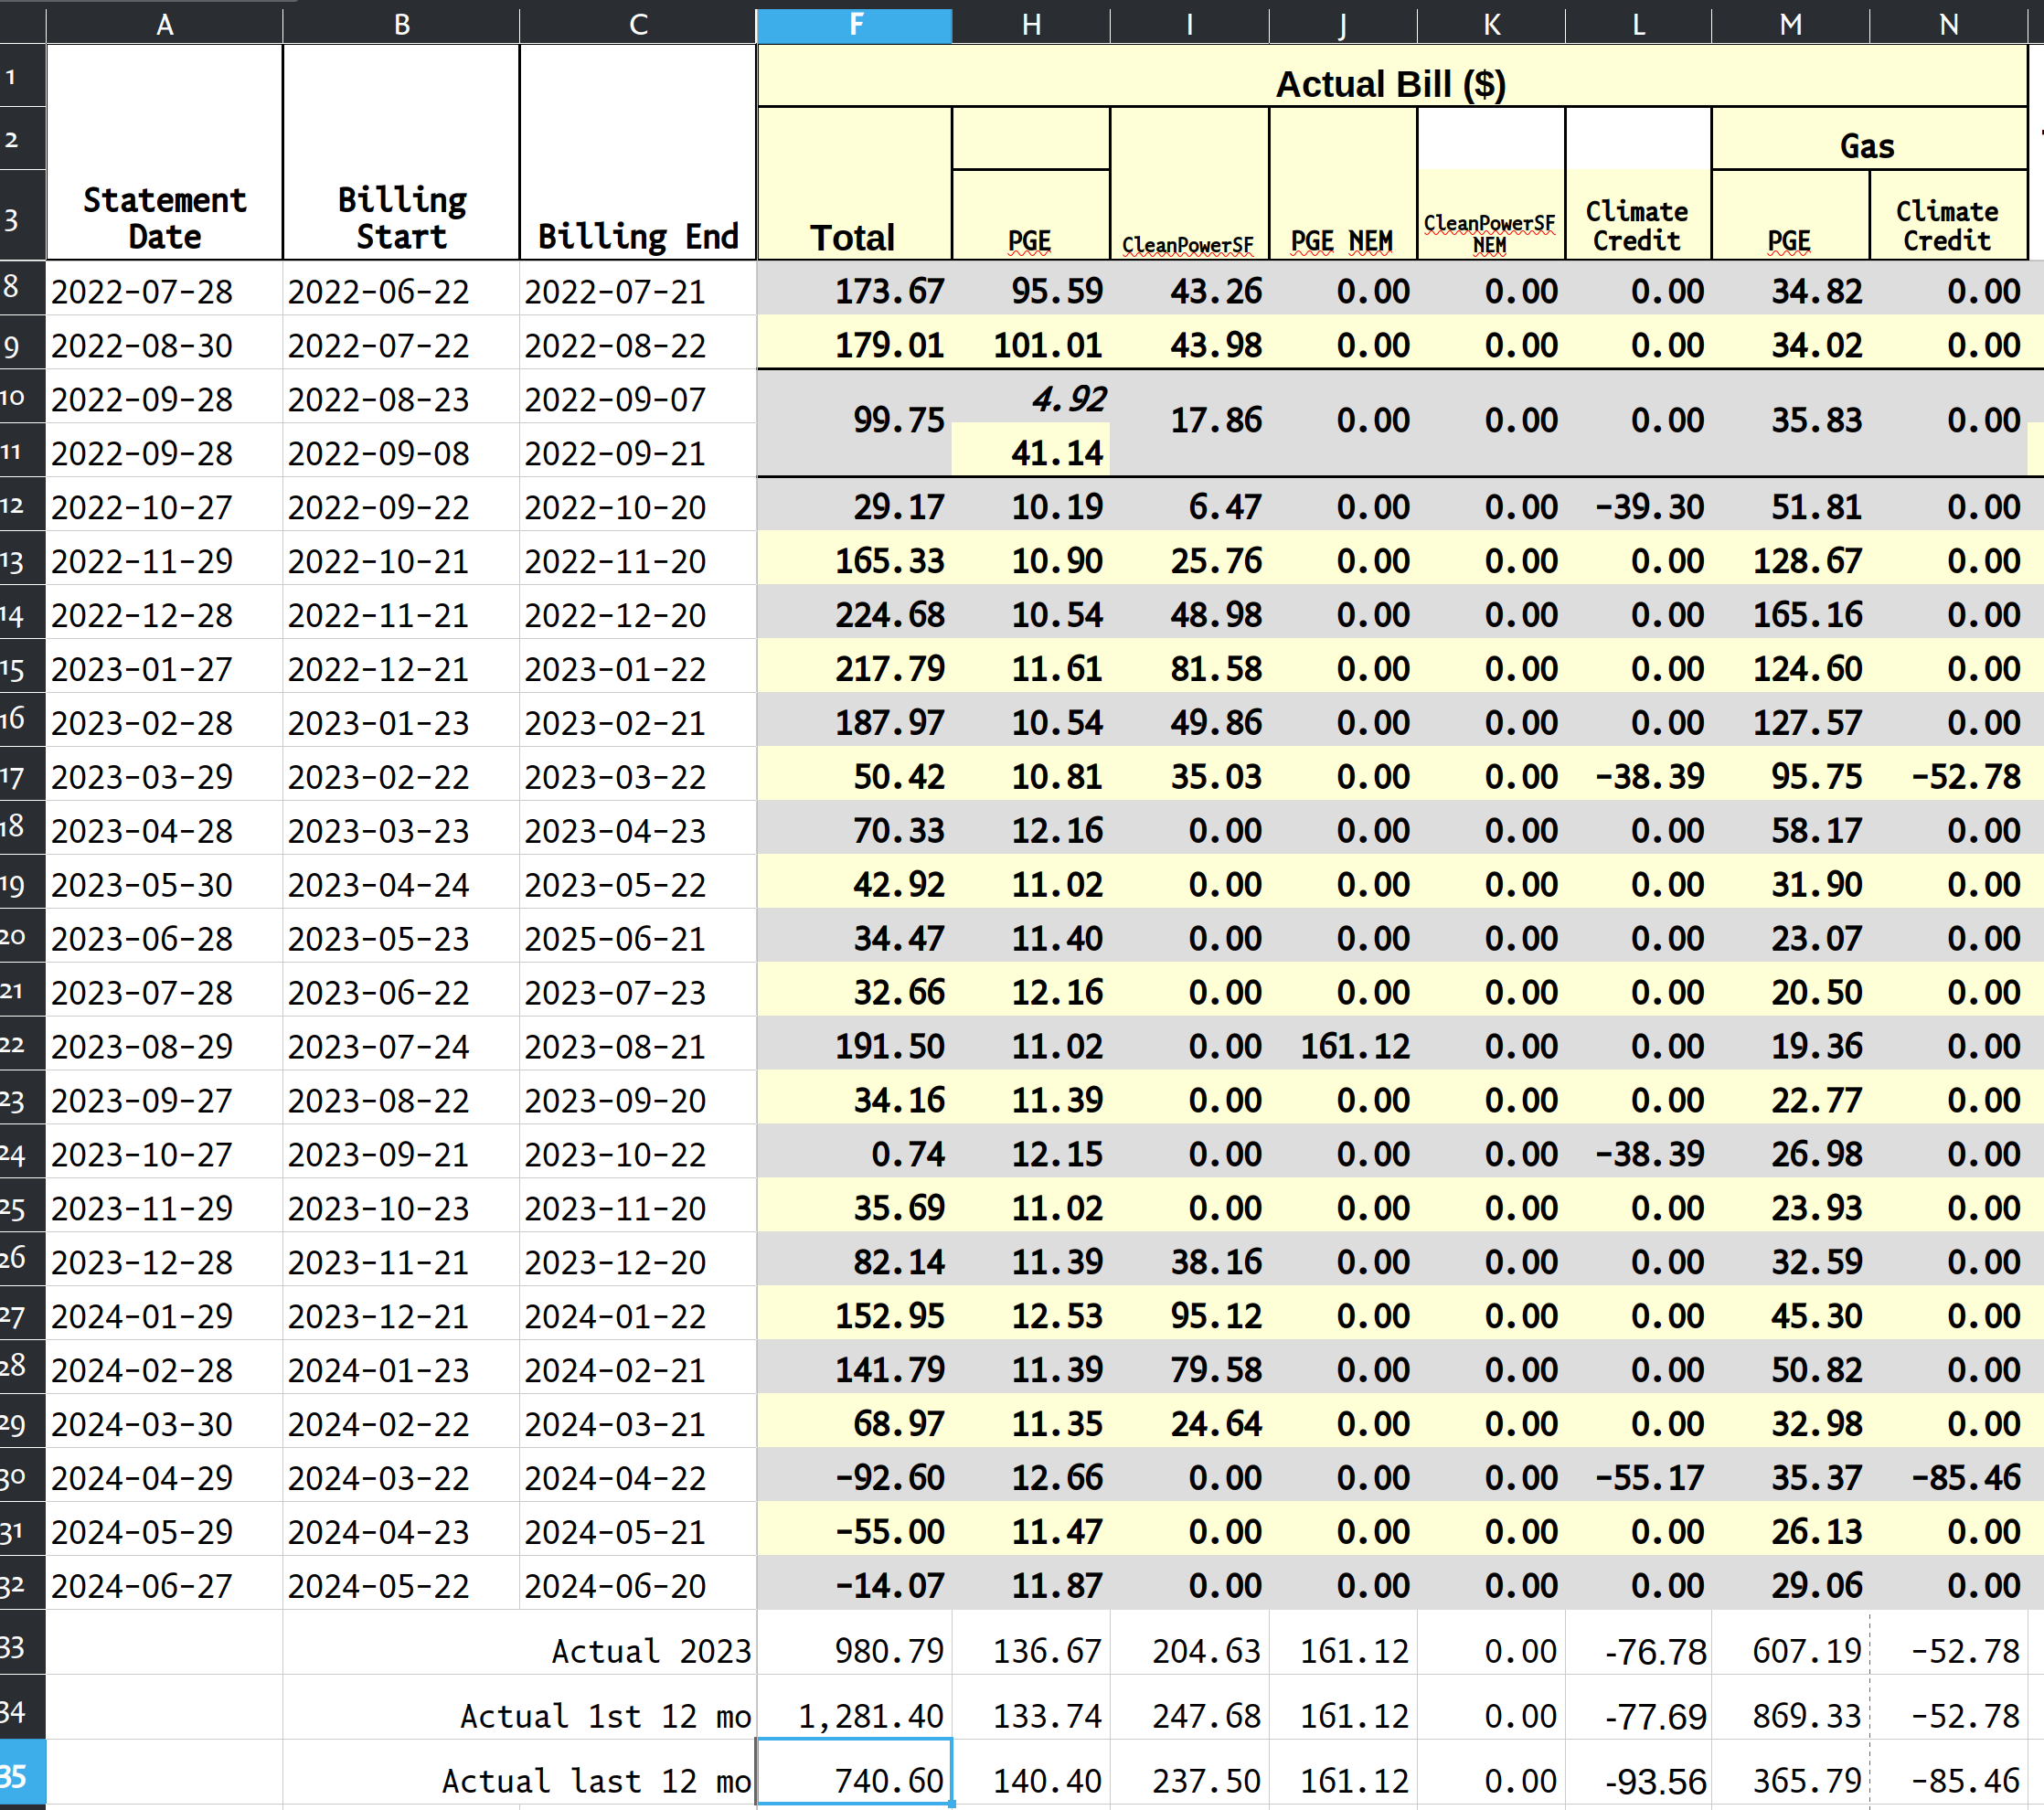
Compilation of PG&E Summaries of Charges
All of these values are in dollars. The bold-faced numbers come directly from PG&E bills. Actual 20231 comprises rows 15–26. Actual first 12 months starts with the first full-month NEM bill, row 12, and ends with row 23. Actual last 12 months covers rows 21 to 32; note that the Total value for that summary row doesn’t include the negative numbers because PG&E doesn’t pay back credits; it just reports them and counts them against the next bill2.
So we paid $980.79 for one year. If you move the window earlier in time, it rises to $1281.40, and later, $740.60. Why is there so much variation? These totals include gas; after realizing how much we were paying for gas, we switched to electric space heaters3 in March 2023. Let’s take the gas out of the bills.
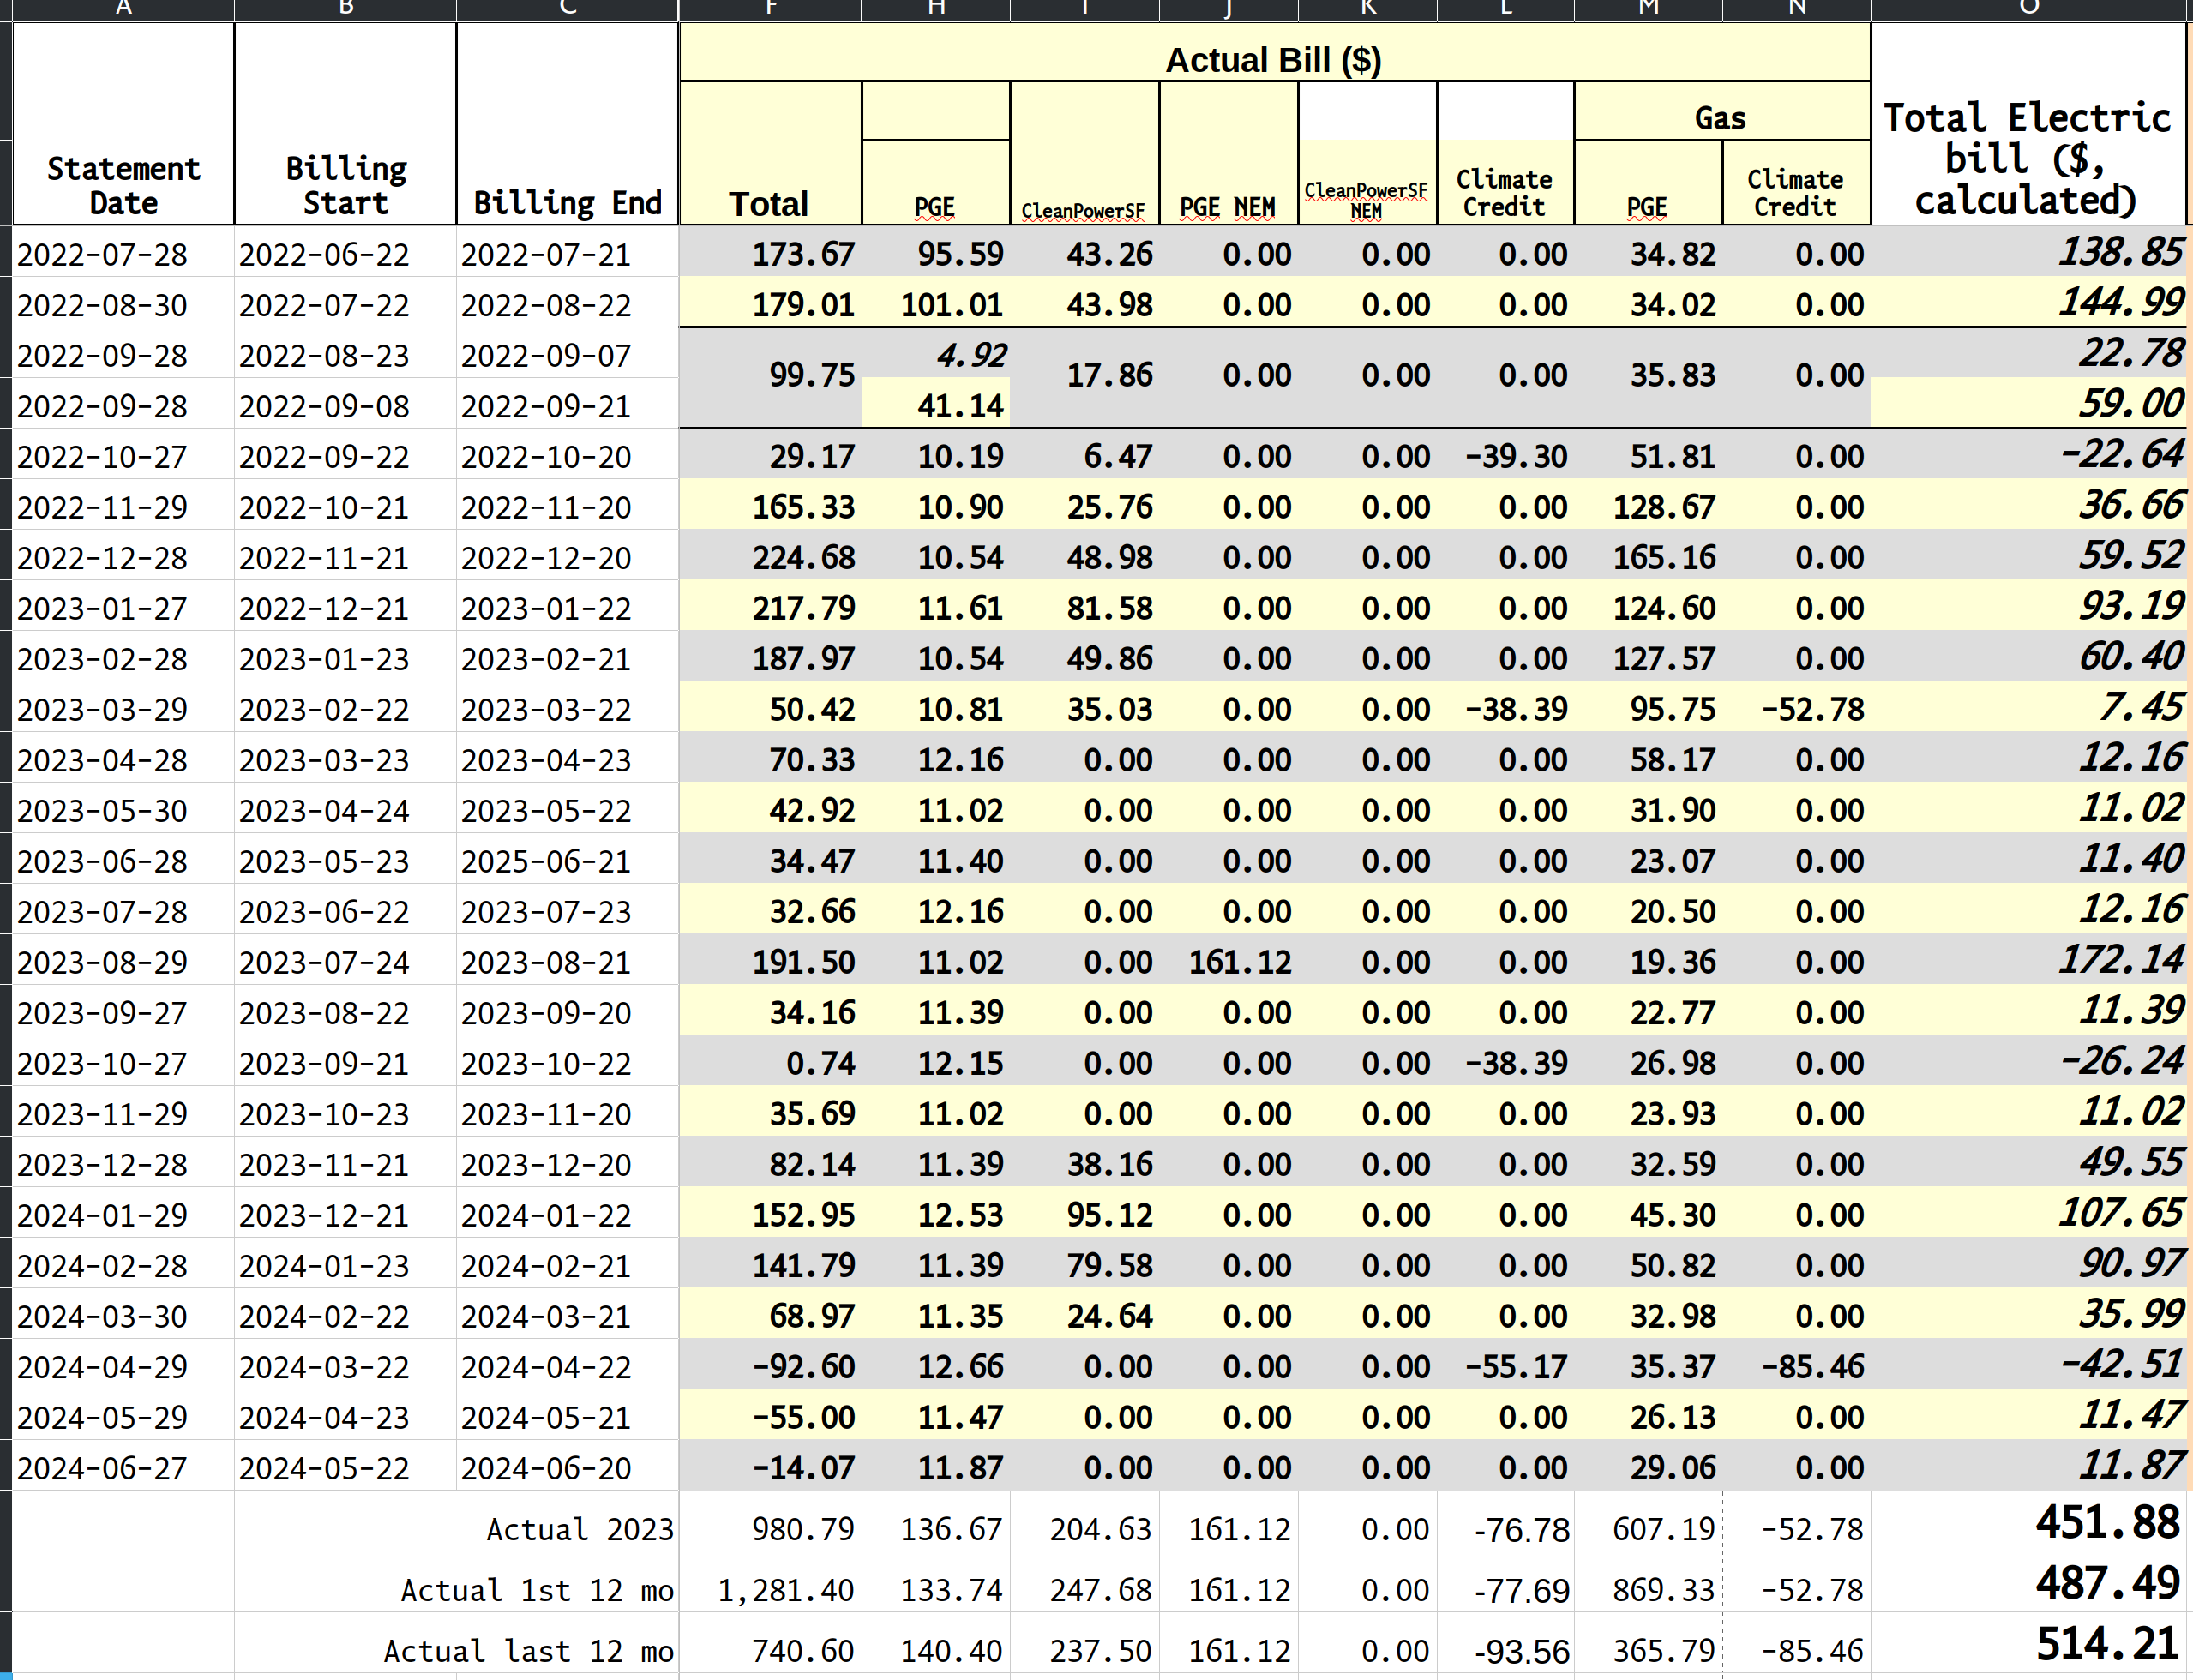
Total Electric Bill
And now we have $451.88, $487.49, and $514.21. These are a bit closer to each other; let’s take the most recent, which is also the highest, as a relatively conservative guess of our true annual electric bill.
How much did PG&E charge us for electricity in 20231: Second Half of Second Try
This requires a counter-factual, since we actually had solar in place and this is what it would have cost if we didn’t. There are four different active rates, and our actual bills reflect a mix of solar exported during the daytime (lower) rates and energy consumed mostly at evening (peak) rates, and the rates change every few months.
So we’d need to figure out exactly how much energy we would have used without solar hour-by-hour for the year. We can actually get the data to do that, and in a later post we’ll see why I spent months wrestling with that data.
But we can get a rough guess with the data we already have, so let’s pretend in retrospect that I was smart enough to do that before I did it the hard way. If we total what we actually paid for electricity and divide it by how much we actually imported, we get an average of $0.56 per kW·h for 2023. That seems a little high, since the highest rate was only $0.48 in January 2023, and didn’t break $0.56 until … New Year’s Day 2024. Let’s assume that’s wrong, and look for an unvetted source on the internet.
The average electric rates in San Francisco, CA cost 43 ¢/kilowatt-hour (kWh)[^10]
Good enough! Multiple that by our actual consumption of 8600 kW·h, and we would have paid $3698.
The same source says the average San Francisco resident pays “$4,248 per year … using 9,912 kWh over the course of the year.”
As we update our table, we probably need to split out our two realities, with and without solar panels. The $827 figure comes from the original spreadsheet; it’s what I estimated PG&E would charge in the scenario with 9 panels and high usage, where the panels really wouldn’t be enough.
| Question | Estimate from April 2022 | Actual for
20231 |
|---|---|---|
| How much electricity will we use between 2023 and 2032? | Between 3217 and 5835 kW·h per year | 8600 kW·h |
| How much would PG&E charge for that? | Between $1287 and $2334, increasing 7.6 percent per year | $3698; 10.4% rate increase. |
| How much did PG&E charge for whatever solar didn't offset? | Between $0 and $827, increasing 7.6 percent per year | $500; 10.4% rate increase. |
| How much will the system cost to install and operate? | $17,000 or $20,000 | $14,357 |
| How much electricity will the system generate? | 3915 kW·h or 6934 kW·h, decreasing 1% per year. | 7700 kW·h |
The bottom line
We can finally update our break-even forecast, which is now includes a little bit of backcast.
The original Forecast
Here’s the original forecast, or at least what it should have been if I’d made fewer mistakes at the time4, for comparison.

Corrected High Estimate forecast
The Forecast with one year of backcast

Forecast updated with 2023 data
If my calculations are correct, or at least if my mistakes mostly counteract each other, break-even is not eight years from install date; it’s four.