We Have Solar at Home Part 2: How Much Will It Cost?
Next: We have Solar at Home Part 3
Previously: We have Solar at Home Part 1.
| Question | Estimate from April 2022 |
|---|---|
| How much electricity will we use between 2023 and 2032? | between 3217 and 5835 kW·h per year |
| How much will PG&E charge for that electricity? | $0.43 per kW·h, increasing 7.6 percent per year |
| How much will the system cost to install and operate? | ? |
| How much electricity will the system generate? | ? |
How much will the system will cost to install and operate?
I had no idea. I knew solar panel prices had collapsed since my childhood; I’d seen graphs like this:
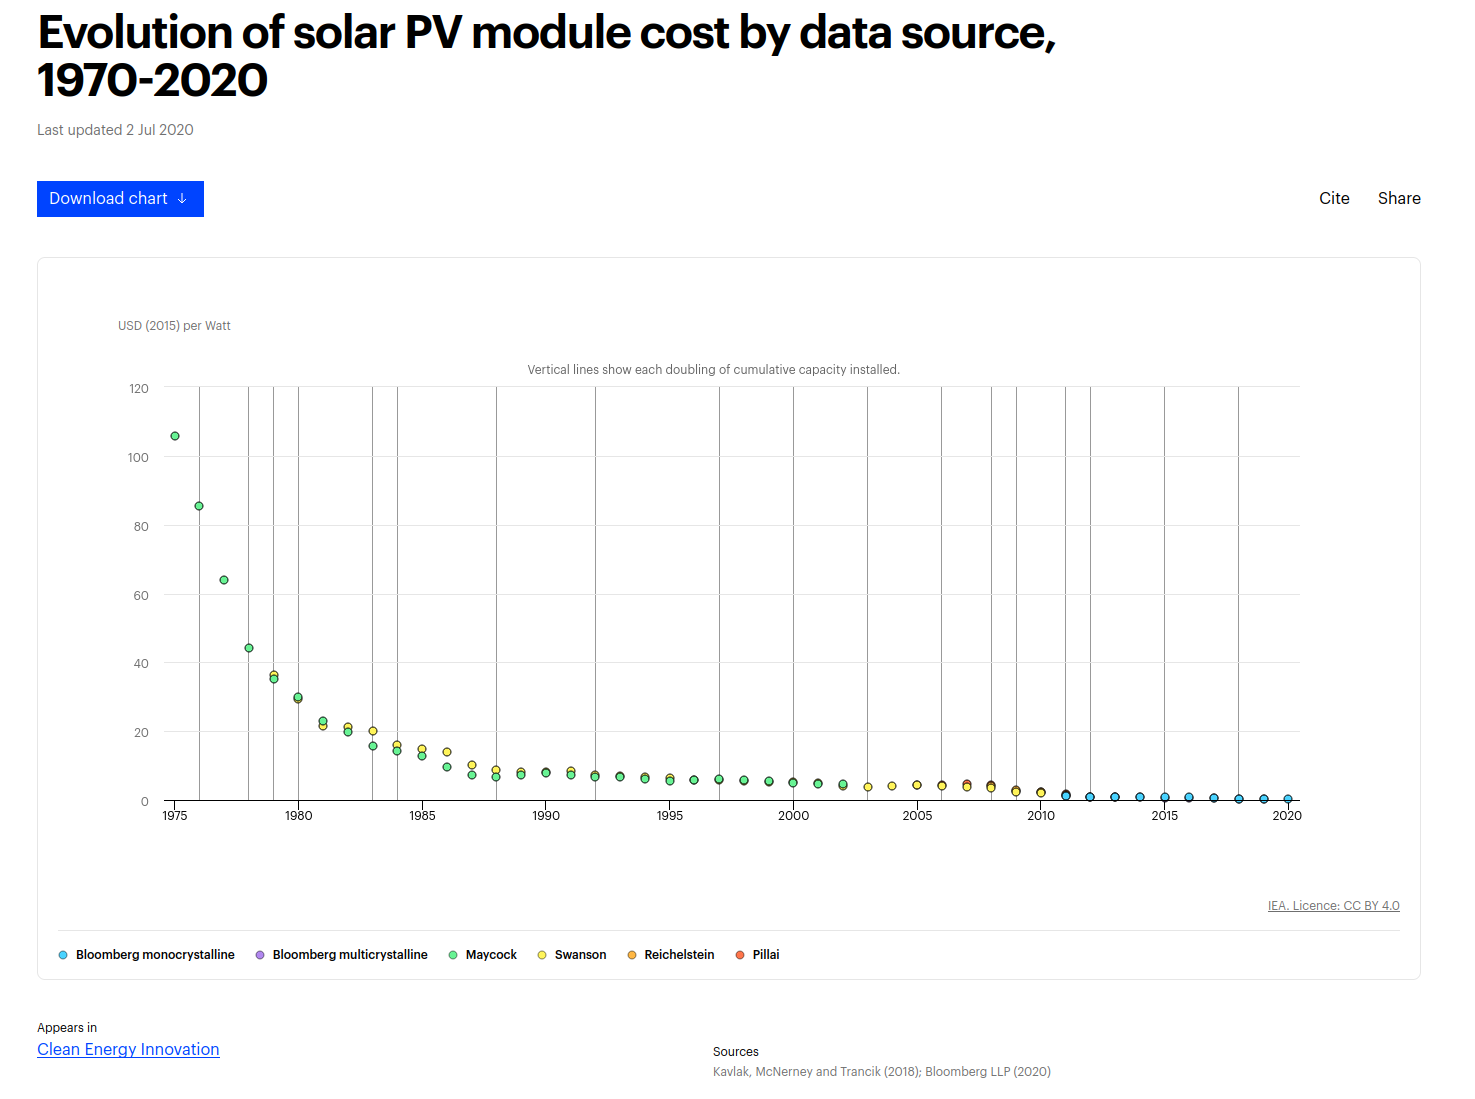
So I had a vague hope that the panels would be under $10,000, which felt extremely cheap, at least relative to other home improvement projects. Note that a 1980 dollar is worth six times more than a 2020 dollar, so any intuitions about cost over decades are very tricky. The batteries on our electric bike were over $500 each, so I knew battery storage could easily be another $10k. At the same time, I assumed we would never be able to offset all of our usage with solar. My brain was still calibrated to Jimmy Carter’s White House panels2, and a general sense that solar power is very weak3. But even if solar only took a medium-sized bite out of the electric bill—which was shaping up to be hundreds of dollars a month—it could still pay for itself.
It turns out that the panels themselves were never even half of the cost.
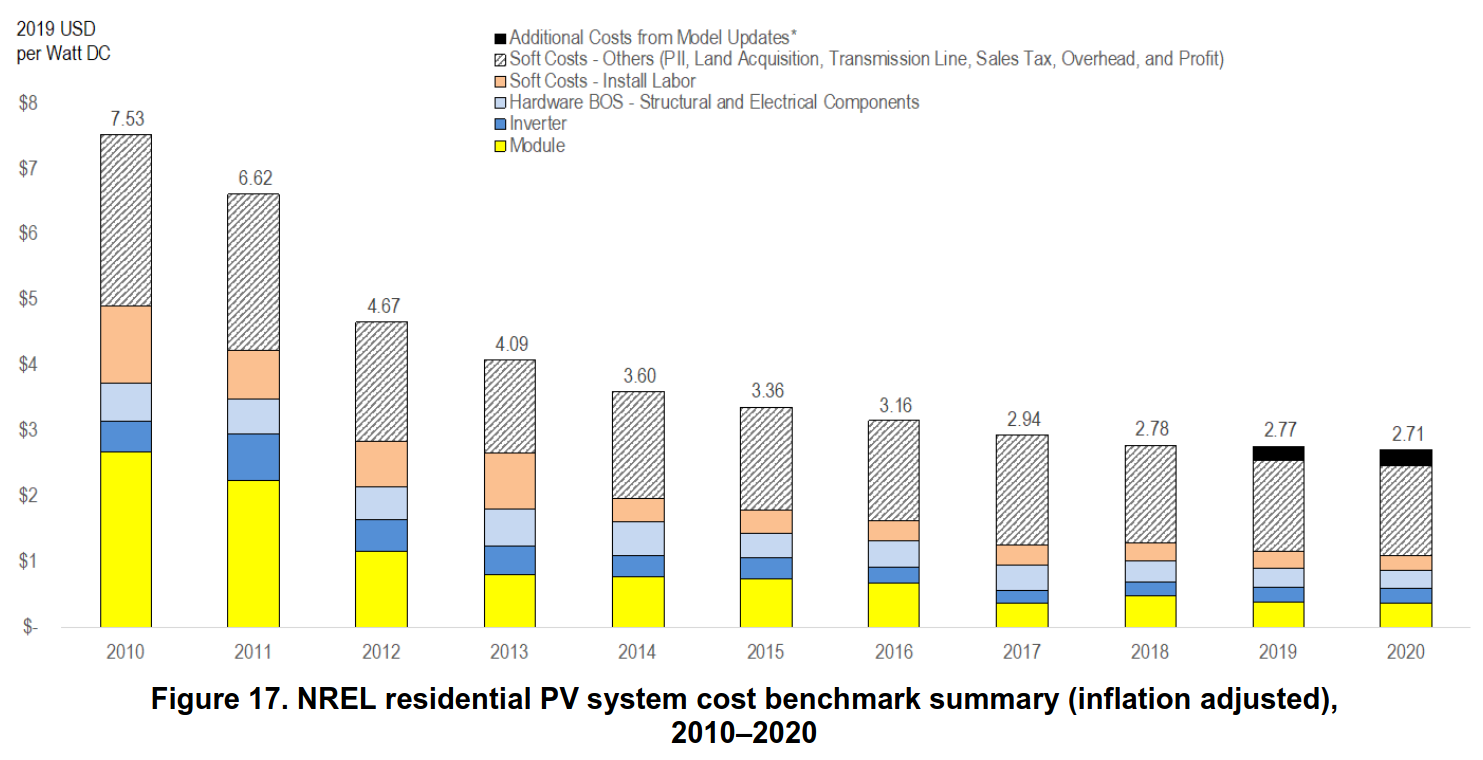
Panels got 90% cheaper in a decade, but total cost only dropped 60%, so the overall project savings are diluted compared to, say, giant TVs. On the other hand, modern panels are very efficient. If we covered the entire roof, we’d generate far more energy than we could use. You might think generating more clean power is a good thing, because if we can’t use it someone else can. This is our cue to talk about regulatory capture.
No, just kidding, you can read about regulatory capture from many better sources. Just take it as given that the leadership of the California Public Utilities Commission has favorites among its constituencies5. California passed a law in 20136 that created NEM2. The meaning of NEM2 for our purposes is, we can connect solar panels to the grid, and PG&E has to let us, and they have to buy back our excess electricity if we have any. I’ve heard that they have to pay market rate for it, which would between $0.3 and $0.6 per kW·h, but I’ve also heard they only have to pay a few cents for it. The power companies got NEM2 replaced with NEM3, which is a much worse deal for solar panel owners, but we—meaning the vendor—got our paperwork in half a year to spare, so we will remain legacied7 under NEM2 for 15 years. Either way, it’s apparently in our financial interest to make exactly as much solar as we need, so we don’t want to get the 30 or more that would fit in the square footage of the roof.
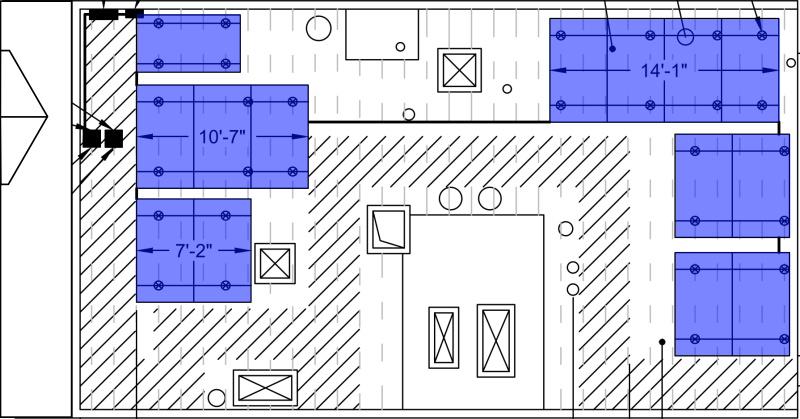
We—meaning the vendor—sketched numbers for 9-panel and 12-panel arrangements, and their roof guy came with a big ladder and climbed around taking notes.
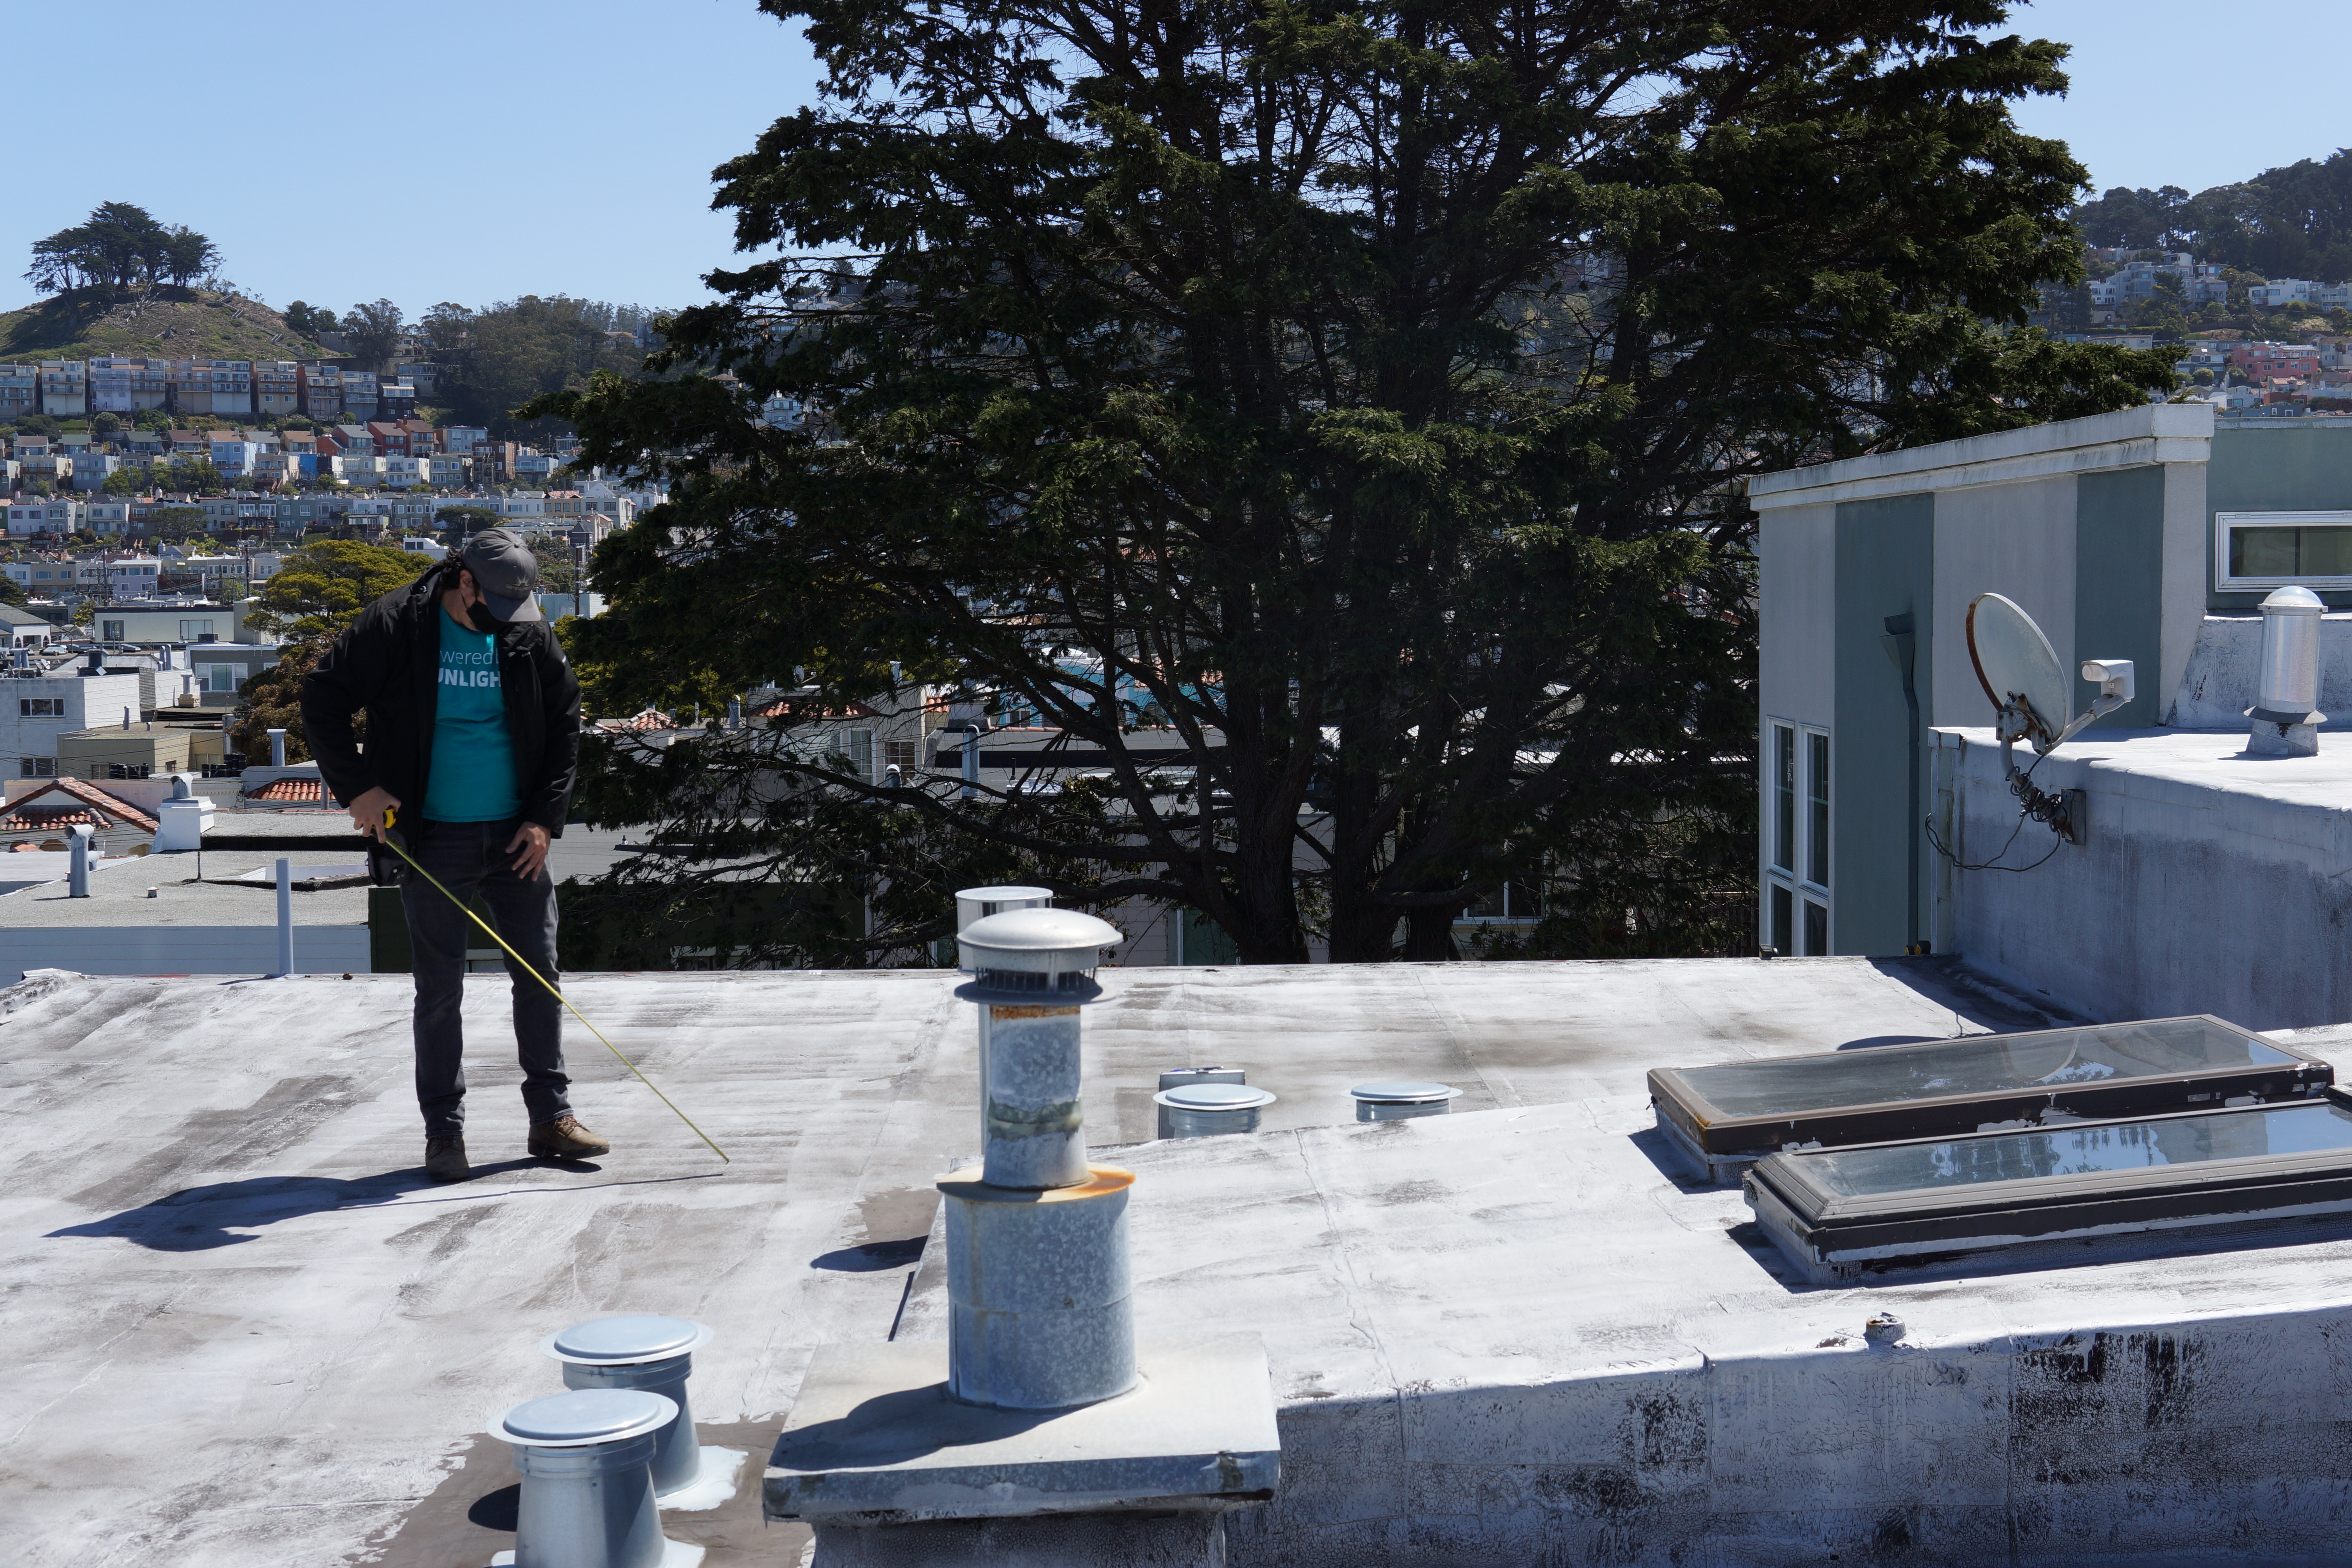
As it turns out, the skylights, pipes, vents, access walkway, and setbacks8 together block more than half the roof …
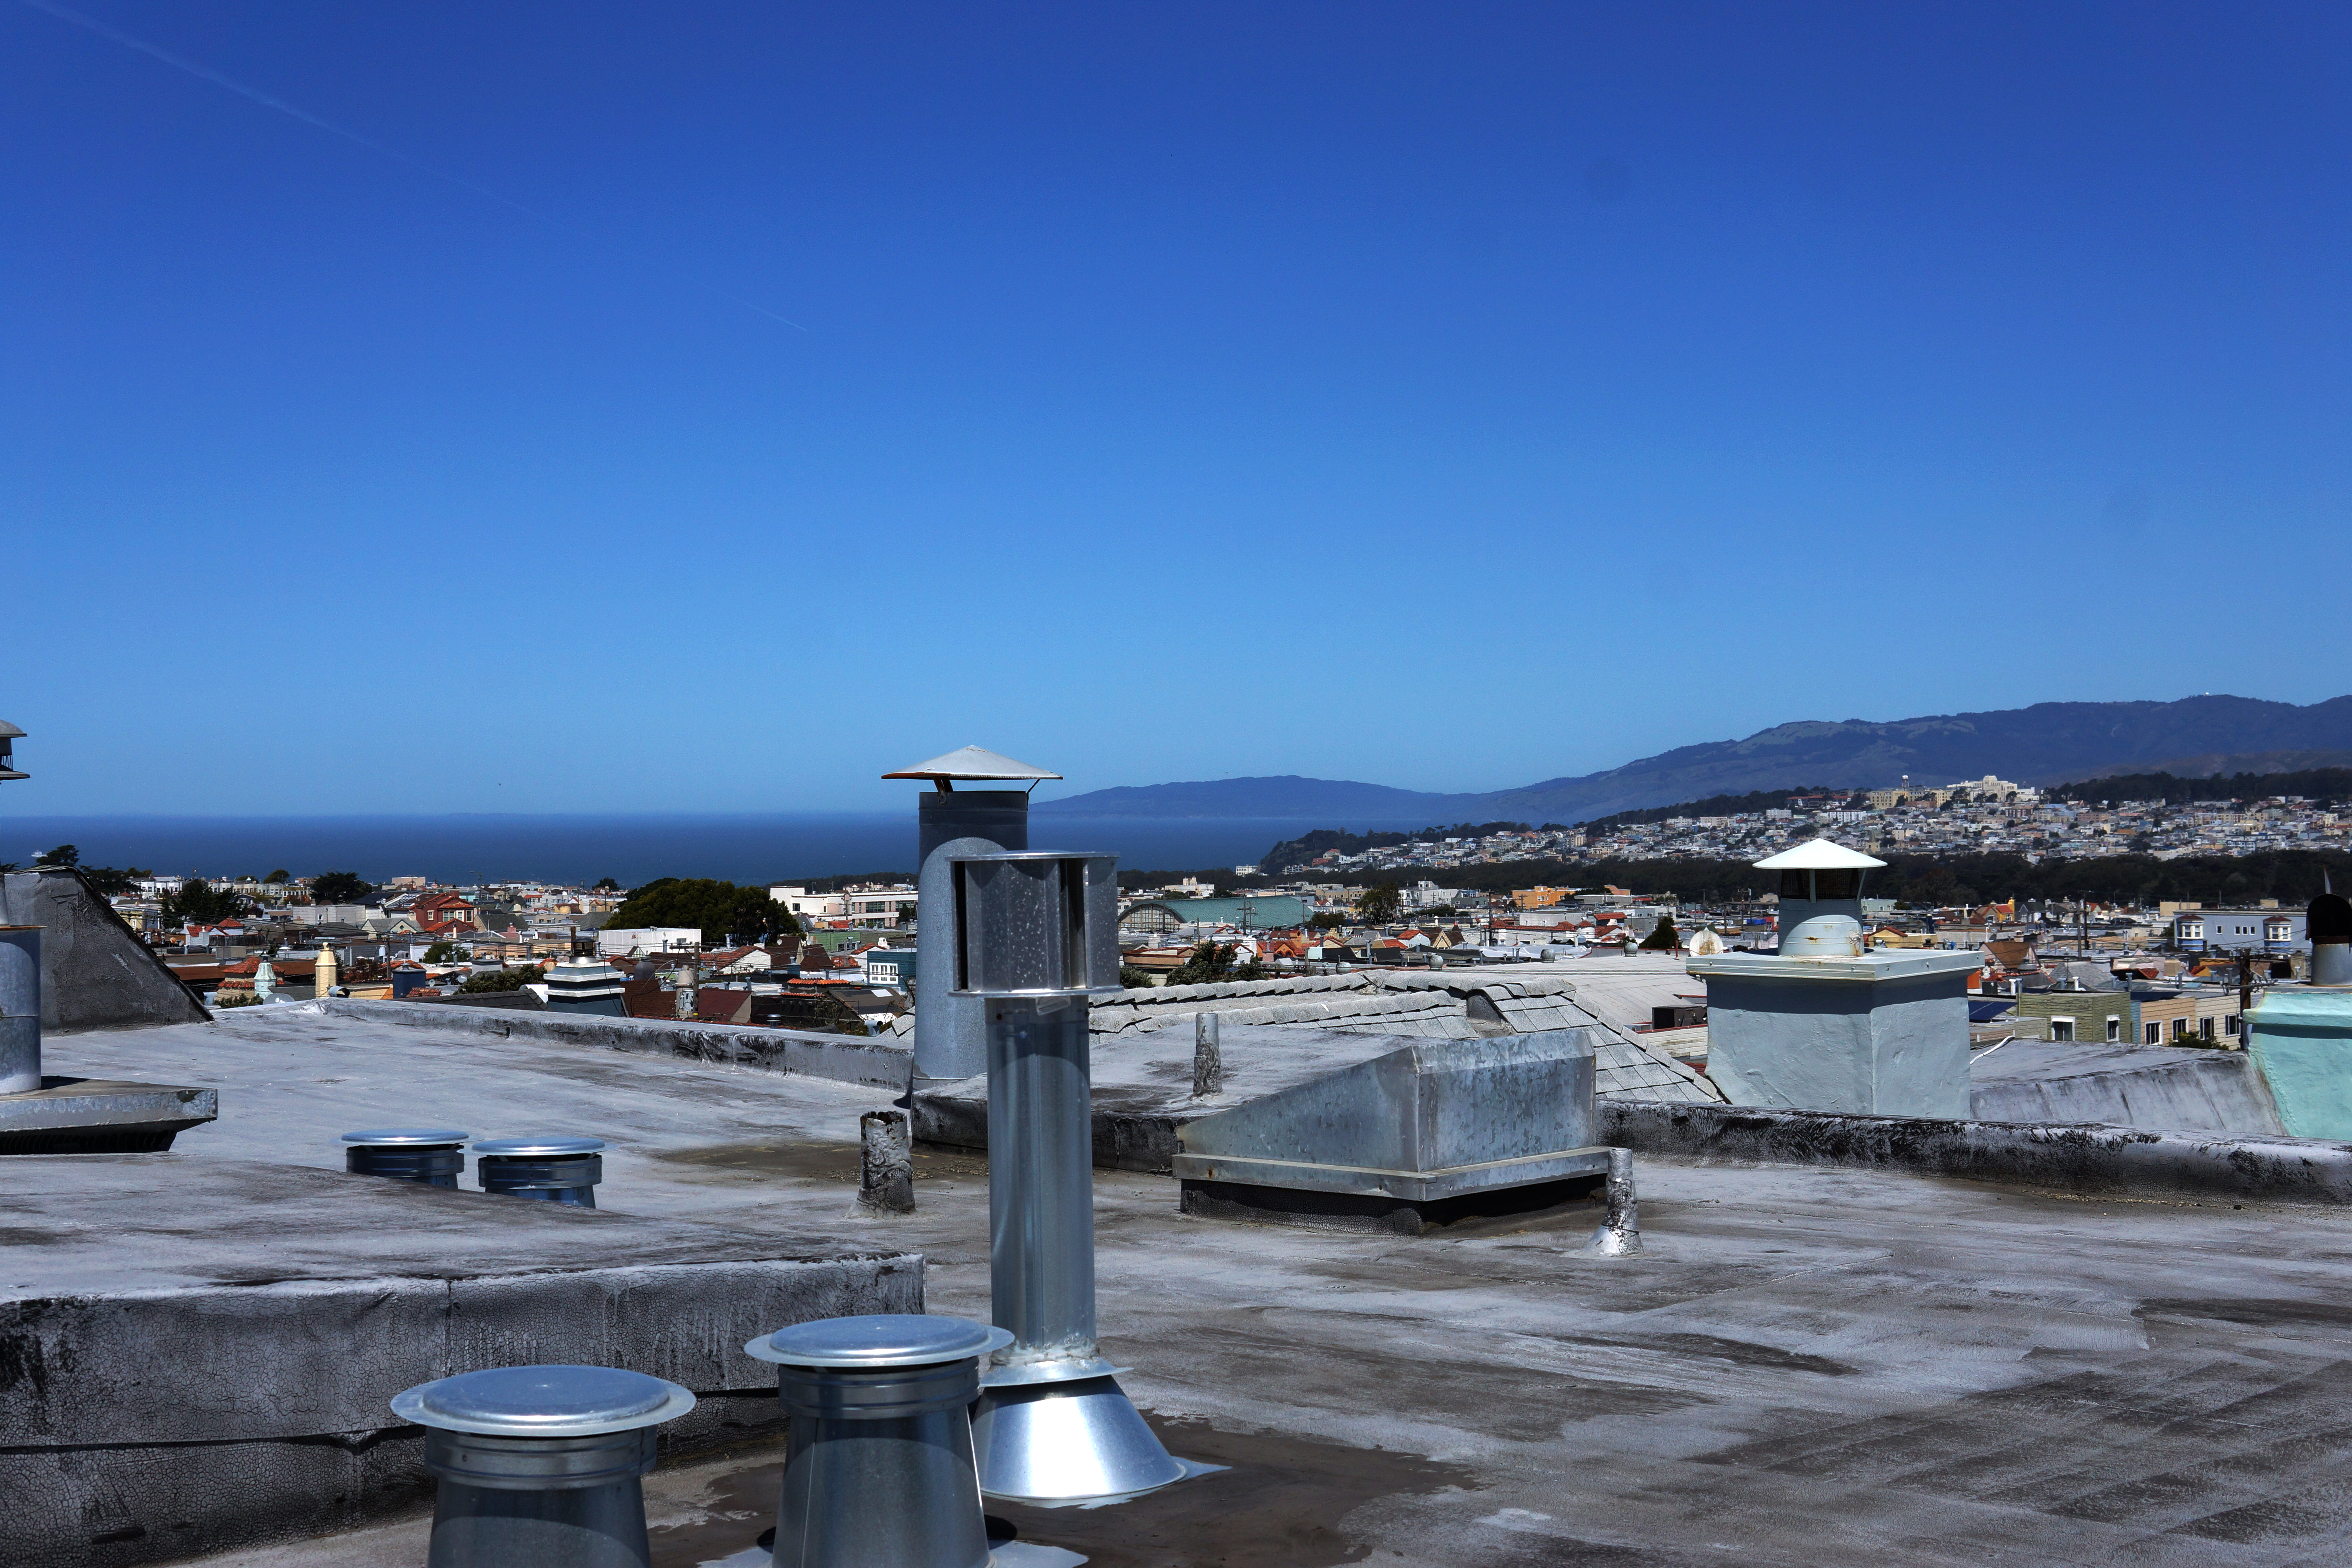
… so we can’t go much above 12 anyway9.
With NEM2, if you have no battery, the solar power goes directly back to the grid. You don’t actually use your own solar power; you just have something on the roof that lowers your bill. If PG&E goes out, we go dark. We can accept that for now, but if PG&E’s already mediocre reliability drops further10 ….
The vendor provided two cost estimates, 9 panels for $17,000, and 12 panels for $20,000, and we planned for a 24% non-refundable tax credit, so the cost would be $12,920 or 15,20011. The systems generally don’t need cleaning or any other maintenance, so operational costs should be um … zero? If we need to do something to the roof, the company will remove and re-install the panels at no extra charge. Once.
So $12,920 or $15,20012 $17,000 or $20,000 is the third of four answers. Tune in next week for the last question, How much will the system offset our usage?. Bonus: I’ll tell you a Homeowner Horror Story. It’s called, The Dryer That Didn’t Get Used For Six Months.