We Have Solar at Home Part 7: Two Years Later Continued
Next: We Have Solar at Home Part 8.
Previously: We Have Solar at Home Part 6.
| Question | Estimate from April 2022 | Actual for
20231 |
|---|---|---|
| How much electricity will we use between 2023 and 2032? | Between 3217 and 5835 kW·h per year | 904 from PG&E plus an unknown amount of solar used on site |
| How much will PG&E charge for that electricity? | Between $1287 and $2334, increasing 7.6 percent per year | ?$, increasing 10.4% in calendar
20232 |
| How much will the system cost to install and operate? | $17,000 or $20,000 | ? |
| How much electricity will the system generate? | 3915 kW·h or 6934 kW·h, decreasing 1% per year. | ? |
How much did the system cost to install and operate?
We expected a 24% non-refundable tax credit, but the Inflation Reduction Act, signed in August 2022, bumped that up to 30%. So that’s a total cost of $14,357. Arguably the $500 (pre-credit) for the extra 240V power outlet shouldn’t count, but we’ll leave it to be consistent with the conservative (pro-status-quo, anti-solar) bias we’re using to guard against excess optimism.
How much electricity did the system generate in 2023?
The monitoring package we’re using—meaning, the one the vendor provided—is called SolarEdge, which is another company. There’s a box in the garage, next to the inverter, that reads the data and sends it out (via cellular, I think) to SolarEdge, which collects it and provides a UI. I don’t actually know what our business relationship is with SolarEdge. Did we—meaning our vendor—buy the monitoring unit and therefore get lifetime monitoring service? That might be good to know. Anyway, a SolarEdge report shows us what we generated in 20233.
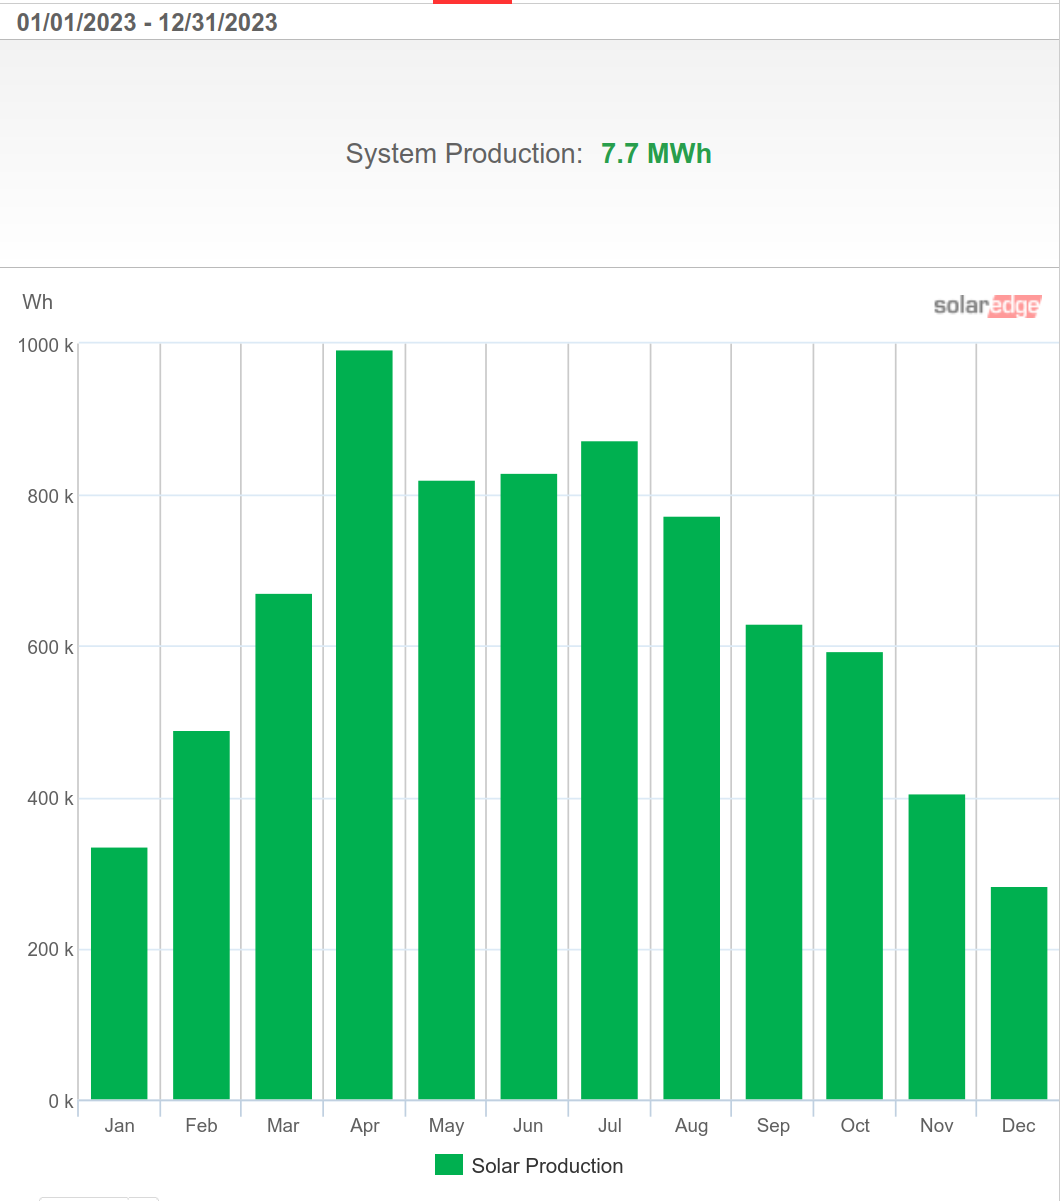
2023 Solar Production by month
The system produced 7.7 MW·h3.
The warranty
Simply Solar warrants that in the first 12 months of operation, the PV solar system will generate a minimum of 90% of the quoted kilowatt-hours production. The quoted annual production of the solar system is 7418 kWh .
7.7 MW·h is more than 7.4 MW·h, and certainly more than 90% of 7.4. Of course that’s Jan–Dec 2023 and the first 12 months was Sep 2022 to Aug 2023, but I’m pretty sure it was more than enough either way. So that’s a solid pass.
How much electricity did we use in 2023, 2nd Attempt
Knowing the total generation in 2023, we can now calculate how much energy we actually used, which is the solar output plus the net grid usage: 8600 kW·h. If that didn’t make sense right away, consider this graph combining total solar production in yellow and net usage in black. There’s one trick: if the net usage is negative, a surplus, there’s no black bar for that period, and the yellow bar is displaced downward by that amount.4
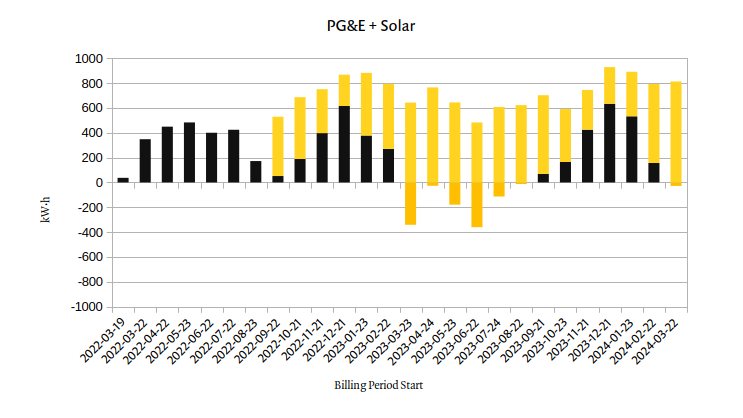
Net usage in black combined with total solar generation in yellow.
We can see a few patterns in this chart. Before solar, we used a very consistent 400 kW·h per month plus or minus 30. In 2022-08, with solar physically present but not hooked up for NEM, usage dropped considerably. From there on, solar generation follows the seasons fairly closely, except that summer 2023 lacks an expected peak. Total usage runs 6 months out of phase: highest in the winter, lowest in the summer; never as low as before solar, and often twice as much. It’s not immediately clear why usage went up so much, but getting the electric dryer working around the same time must be related. We also stopped using the gas furnaces in 2023 and switched to electric space heaters5, but winter 23/24 isn’t really higher than winter 22/23.
We still haven’t worked out how much PG&E charged for those 904 kW·h spread over various times and rates. Next week, we’ll delve into the mysteries of the PG&E bill. Meanwhile, good night and good luck.