We have Solar at Home Part 6: Two Years Later
Next: We have Solar at Home Part 7.
Previously: We have Solar at Home Part 5.
We made four big guesses before buying solar, guesses that collectively forecast that the investment would pay for itself in seven to thirteen years. What happened next?
| Question | Estimate from April 2022 | Actual for
20231 |
|---|---|---|
| How much electricity will we use between 2023 and 2032? | Between 3217 and 5835 kW·h per year | ? |
| How much will PG&E charge for that electricity? | $0.43 per kW·h, increasing 7.6 percent per year | ? |
| How much will the system cost to install and operate? | $17,000 or $20,000 | ? |
| How much electricity will the system generate? | 3915 kW·h or 6934 kW·h, decreasing 1% per year. | ? |
How much electricity did we use in 2023?
PG&E provides three relevant numbers in each bill:
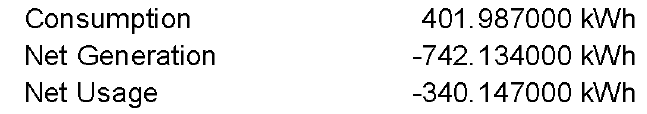
PGE Service information for 2023-03-23 to 2023-04-23
but they got renamed starting with the July 2023 statement forward. The new names are actually clearer.
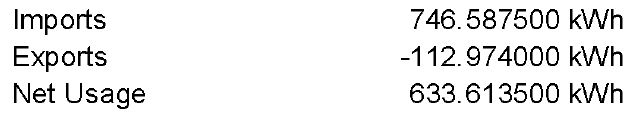
PGE Service information for 2023-12-21- to 2024-01-22
| Original name | New name | Meaning |
|---|---|---|
| Consumption | Imports | How much energy PG&E provided |
| Net Generation | Exports | How much energy solar sent back to PG&E, as a negative number |
| Net Usage | Net Usage | The net amount of energy PG&E supplied, or Imports + Exports |
The data looks like this:
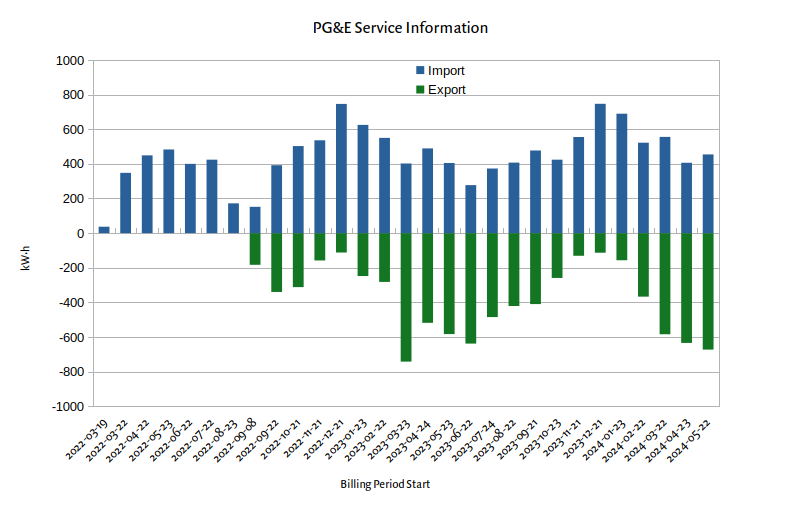
Imports and Exports
If we total up the Import for 20231, it’s 5730 kW·h, or about at the top of our estimated range. However, we Exported a lot too; in fact, the Net Usage figures are exactly the sum of Import and Export.
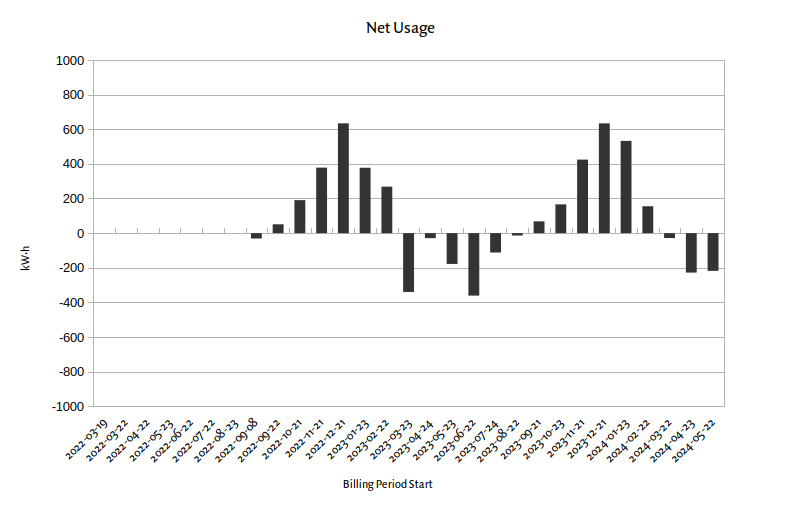
Net Usage
Eyeballing the chart, it’s clear that we’ve imported more than we’ve exported, so we have definitely used more energy than our solar panels provided. If we add up the Net Usage for 20231, it’s 904 kW·h, which is far too low to be our actual consumption. That must be just the net amount of electrical energy PG&E provided.
So apparently the power from the inverter does indeed power our house, and only the surplus at any given moment goes back to the grid, which contradicts my previous understanding that the house ran straight off grid power and, separately, delivered solar power back2. If this is true, then PG&E doesn’t know anything about solar power we consume on-site. To figure out how much energy the household really used, we’ll also need to know how much solar energy we generated. Let’s come back to this later.
How much did PG&E charge for that electricity?
To know this with certainty, we’d need to live in a universe where we didn’t get solar. We can estimate it varying degrees of probable accuracy if we know both how much energy we imported from PG&E and how much we generated from solar, as well as the average rate we paid for the year, but we figure out any of that for several more posts. We can, however, update our guesses about rate increases.
How much did PG&E raise the rate?
At the beginning3 of our solar journey, we learned from the CALIFORNIA SOLAR CONSUMER PROTECTION GUIDE—the document that “Solar providers submitting applications to interconnect residential solar customers in the service areas of … PG&E, … SCE, … SDG&E, … BVES, and PacifiCorp are required” to get customers to initial, that
CPUC has capped this escalation rate assumption at 4 percent per year.
And in fact, the PG&E Solar Estimator uses 2%4. We projected, from the last few decades, that 7.6% would be more realistic. Now that we’ve advanced the clock two years, let’s check the actual data.
We are on PG&E’s rate plan E-TOU-D5,6. Here’s what our rate7 looks like since we bought the house.

Since the sub-rates seem to change in sync, I isolated the Winter Off-Peak rate to simplify comparison with the hypothetical 4% annual growth rate that the California Public Utilities Commission has directed vendors not to exceed in their proposals.

This is an increase escalation of 7.5% from 2022-03-01 (the last rate change before we made our forecast in 2022-04) to 2023-03-01, and another 24.5% to 2024-03-01.
If you wanted to know who wrote the CALIFORNIA SOLAR CONSUMER PROTECTION GUIDE, you might want to start with … PG&E, SCE, SDG&E, BVES, and PacifiCorp.
So we know how much the rate actually went up, and we know how much energy we used on net. To figure out how much we should have been charged, we would need to know which rates applied to that net usage. And if we generate surplus off-peak and consume more on-peak, do we pay the difference? To answer questions like this, we something that PG&E calls the Detail of Bill8, and the internet seems to be calling the Black and White Bill9. It looks like this:
Example from an internet forum
But PG&E doesn’t provide it consistently, and I don’t have access to it10.
We could also add up all of the charges and see what we paid. That’s not quite as simple as it sounds because the PG&E bill is very hard to read and contains contradictory information, and because NEM means the total cost over a time period is not determinable until the time period is over. So far we’ve tackled two of the questions and not answered either. Let’s take a break and try harder next week.